Overview
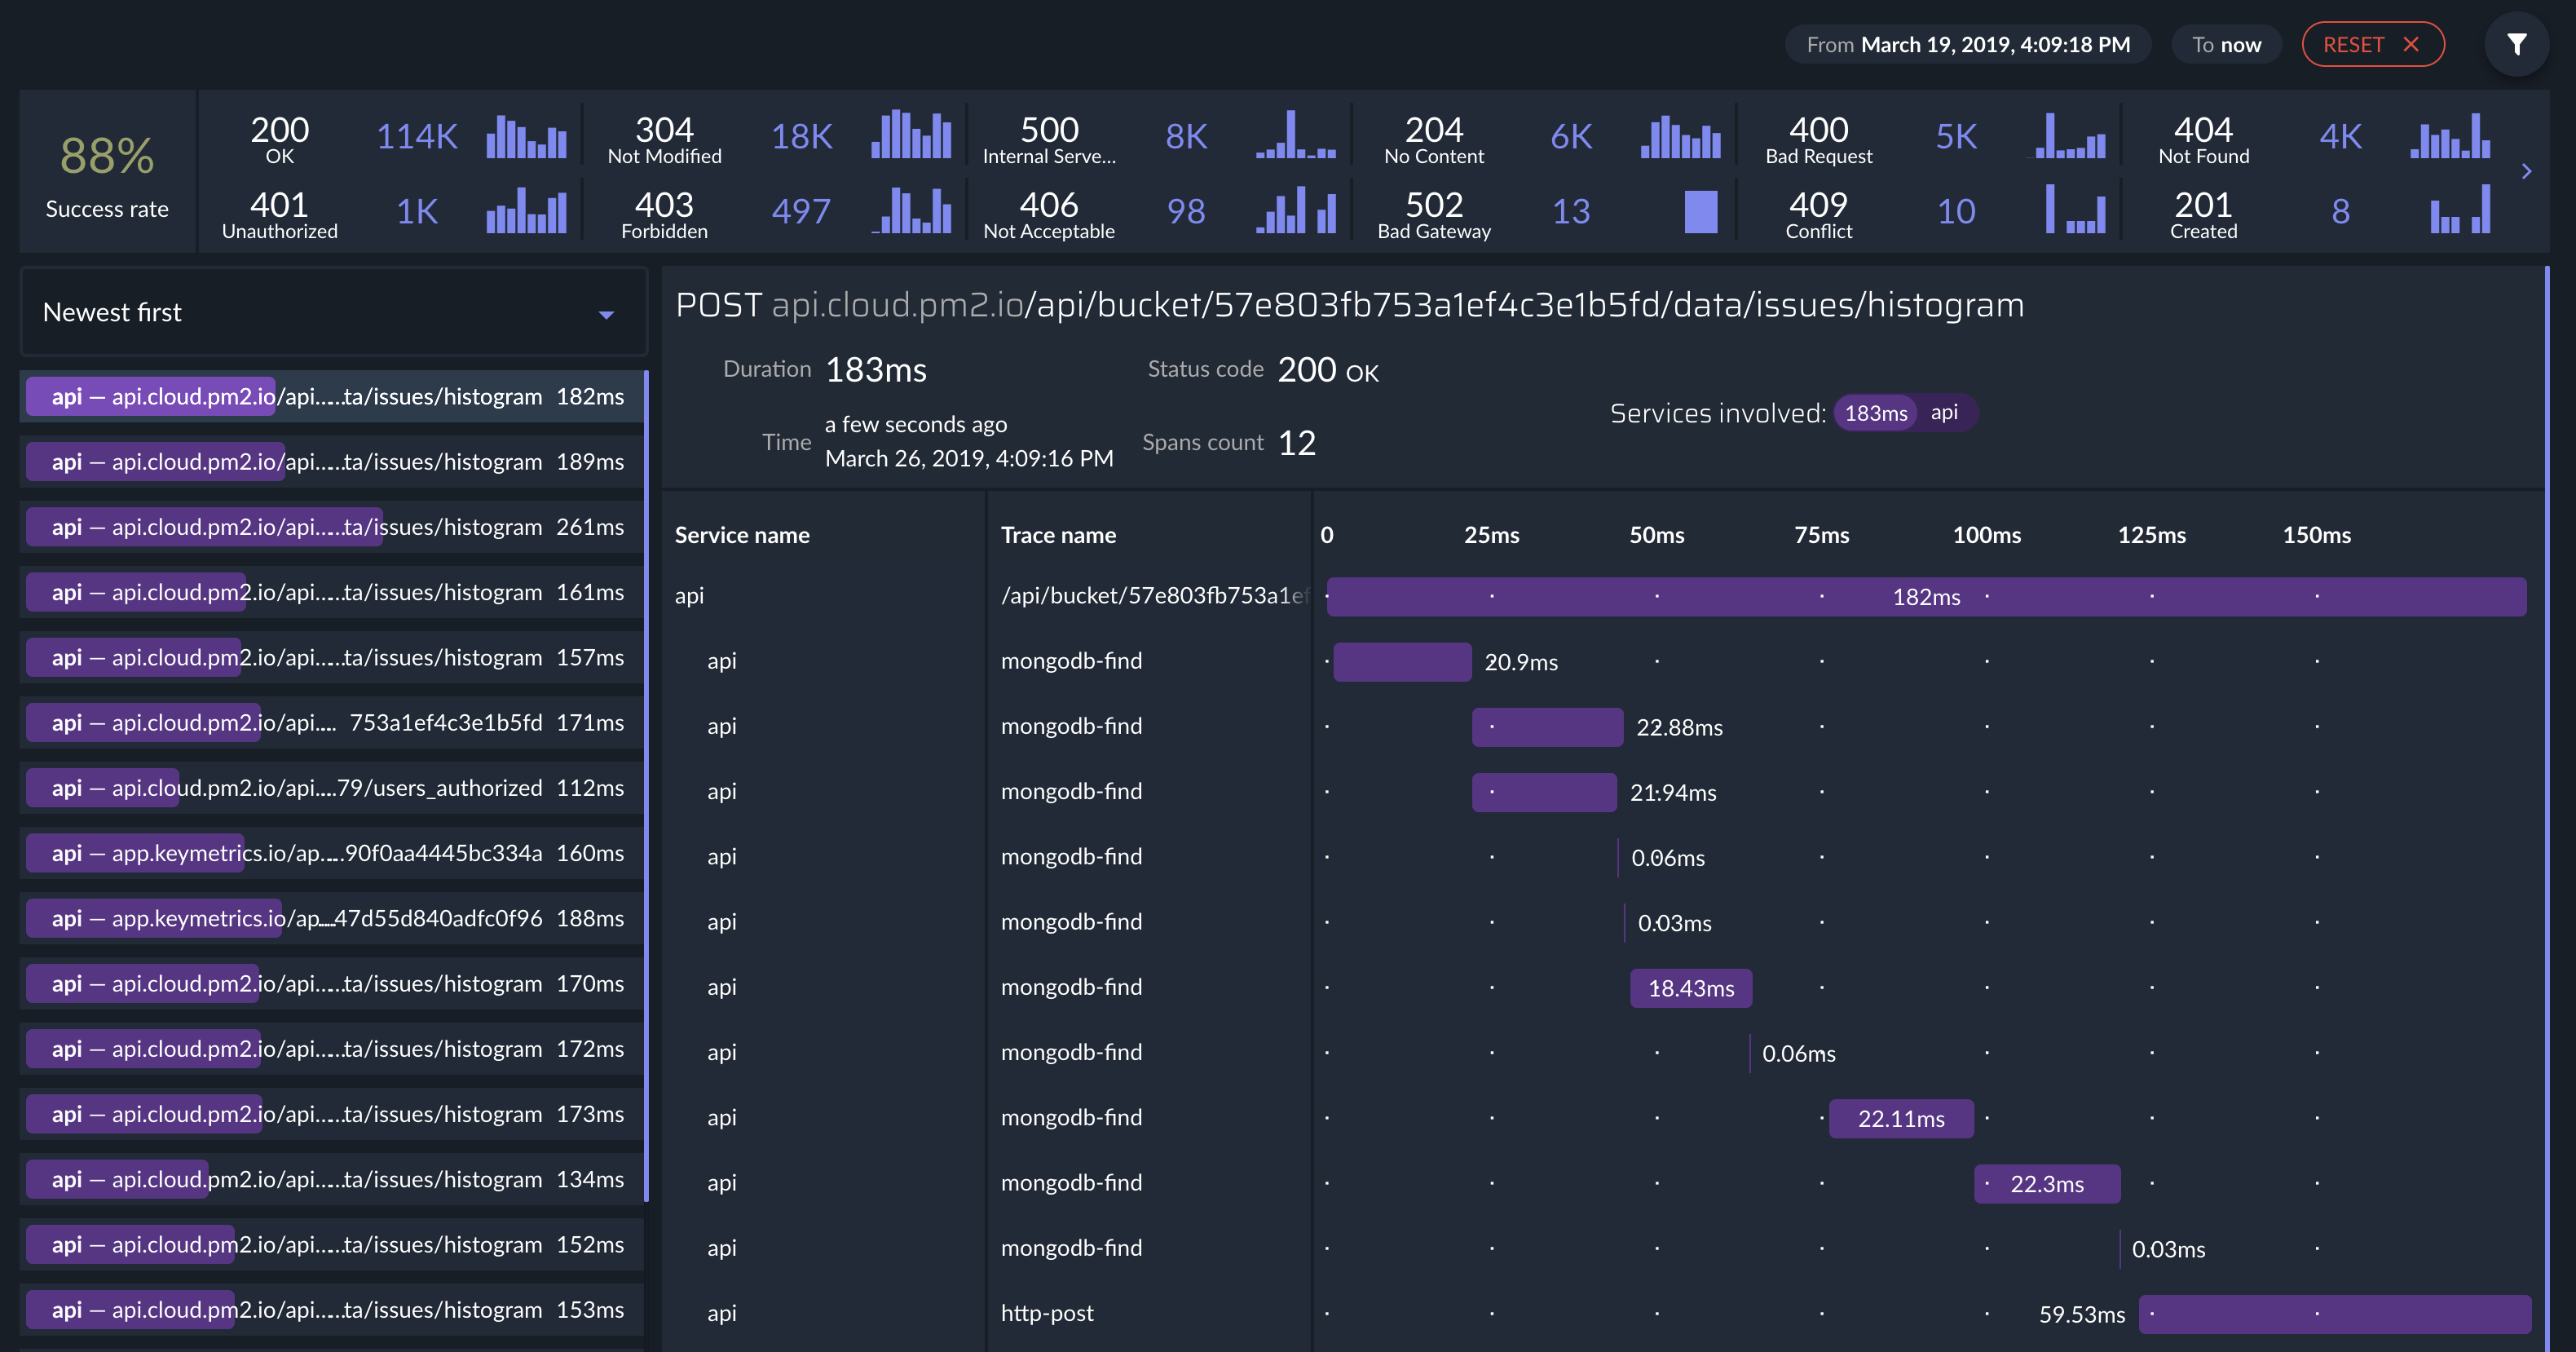
The Distributed Tracing allows to captures and propagates distributed traces through your system, allowing you to visualize how customer requests flow across services, rapidly perform deep root cause analysis, and better analyze latency across a highly distributed set of services.
Modules Traced Automatically
These modules are automatically traced:
- HTTP
httpoutgoing requests - HTTPS
httpsoutgoing requests - HTTP2
http2outgoing requests - MongoDB with
mongodb-coreversion 1 - 3 - Redis with
ioredisversions > 2.6 orredisversions > 2.6 - Mysql with
mysql2version 1 - 3 ormysqlversion 1 - 3 - PostgreSQL with
pgversion > 6 - Vue.js with
vue-server-rendererversion 2
How to use it
Using PM2
First make sure you are using an up-to-date version of pm2 (version > 3.4.0).
Then you can just run the following command to enable the tracing:
$ pm2 reload myapp --trace
To disabled the tracing:
$ pm2 reload myapp --disable-trace
If you want to customize the configuration, you can install @pm2/io module in your package.json. See bellow.
Using the @pm2/io module
You can use the @pm2/io module to customize the transaction tracing configuration:
const io = require('@pm2/io').init({
  tracing: {
    enabled: true,

    // will add the actual queries made to database, false by default
    detailedDatabasesCalls: true,
    // if you want you can ignore some endpoint based on their path
    ignoreIncomingPaths: [
      // can be a regex
      /misc/,
      // or a exact string
      '/api/bucket'
      // or a function with the request
      (url, request) => {
        return true
      }
    ],
    // same as above but used to match entire URLs
    ignoreOutgoingUrls: []
  }
})
By default we ignore specific incoming requests (you can override this by setting ignoreIncomingPaths: []):
- Request with the OPTIONS or HEAD method
- Request fetching a static ressources (
*.js,*.css,*.ico,*.svg,.pngor*webpack*)
Custom Tracing API
The custom tracing API can be used to create custom trace spans. A span is a particular unit of work within a trace, such as an RPC request. Spans may be nested; the outermost span is called a root span, even if there are no nested child spans. Root spans typically correspond to incoming requests, while child spans typically correspond to outgoing requests, or other work that is triggered in response to incoming requests.
How does it work?
Here is a simple example to create a custom trace:
const io = require('@pm2/io').init({ tracing: true })
const tracer = io.getTracer()

function main() {
  // 4. Create a scoped span, a scoped span will automatically end when closed.
  tracer.startRootSpan({name: 'main'}, rootSpan => {
    for (let i = 0; i < 10; i++) {
      doWork(i);
    }

    // 6b. End the spans
    rootSpan.end();
  });
}
Using the Tracer
To start a trace, you first need to get a reference to the Tracer (3). It can be retrieved as a global singleton.
const tracer = io.getTracer()
Create a span
To create a span in a trace, we used the Tracer to start a new span (4). A span must be closed in order to mark the end of the span.
// 4. Create a scoped span, a scoped span will automatically end when closed.
tracer.startRootSpan({name: 'main'}, rootSpan => {
  for (let i = 0; i < 10; i++) {
    doWork(i);
  }

  rootSpan.end();
});
Create a child span
The main method calls doWork a number of times. Each invocation also generates a child span. Take a look at the doWork method.
function doWork() {
  // 5. Start another span. In this example, the main method already started a span,
  // so that'll be the parent span, and this will be a child span.
  const span = tracer.startChildSpan('doWork');
  span.start();

  console.log('doing busy work');
  for (let i = 0; i <= 40000000; i++) {} // short delay

  // 6. Annotate our span to capture metadata about our operation
  span.addAnnotation('invoking doWork')
  for (let i = 0; i <= 20000000; i++) {} // short delay

  span.end();
}
End the spans
We must end the spans so they becomes available for exporting.
// 6a. End the spans
span.end();

// 6b. End the spans
rootSpan.end();
Create an Annotation
An annotation tells a descriptive story in text of an event that occurred during a span’s lifetime.
// 6. Annotate our span to capture metadata about our operation
span.addAnnotation('invoking doWork')
Tracing Instance Options
io.init({
  tracing: {
    /**
    * Enabled the distributed tracing feature.
    */
    enabled: boolean
    /**
    * If you want to report a specific service name
    * the default is the same as in apmOptions
    */
    serviceName?: string
    /**
    * Generate trace for outgoing request that aren't connected to a incoming one
    * default is false
    */
    outbound?: boolean
    /**
    * Determines the probability of a request to be traced. Ranges from 0.0 to 1.0
    * default is 0.5
    */
    samplingRate?: number,
    /**
    * Add details about databases calls (redis, mongodb, mysql etc)
    */
    detailedDatabasesCalls?: boolean,
    /**
    * Ignore specific incoming request depending on their path
    */
    ignoreIncomingPaths?: Array<IgnoreMatcher<httpModule.IncomingMessage>>
    /**
    * Ignore specific outgoing request depending on their url
    */
    ignoreOutgoingUrls?: Array<IgnoreMatcher<httpModule.ClientRequest>>
  }
})
Vocabulary
A trace is a tree of spans. It is a collective of observable signals showing the path of requests through a system. This is an example of what a trace looks like:
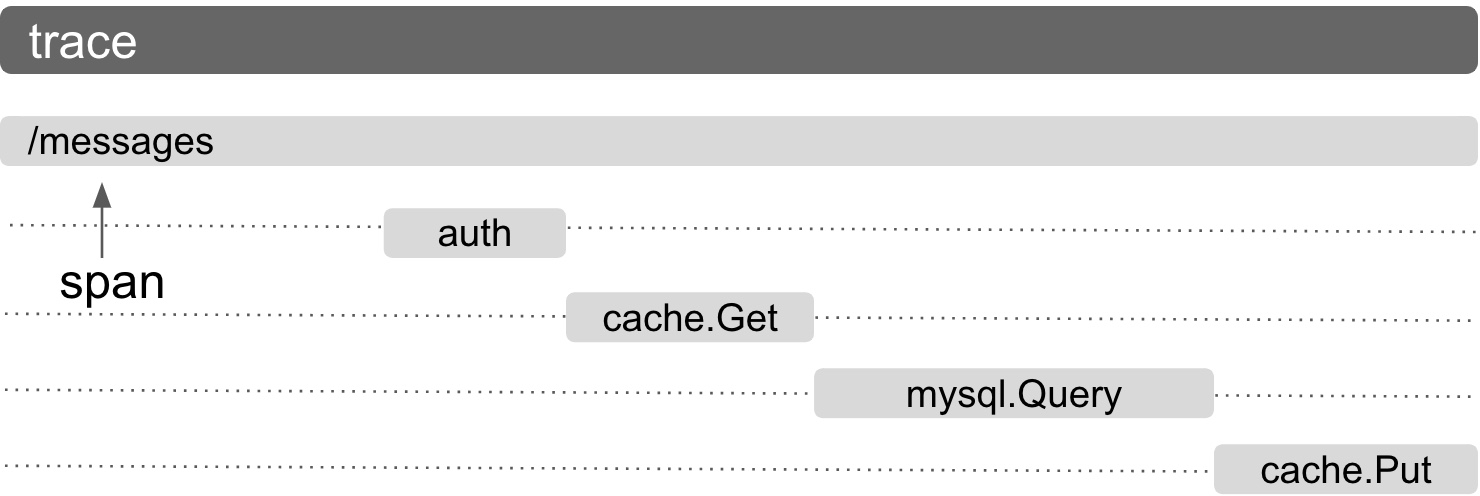
Above, you can see a trace with various spans. In order to respond to /messages, several other internal requests are made. Firstly, we check if the user is authenticated. Next we check if their messages were cached. Since their message wasn’t cached, that’s a cache miss and we then fetch their content from MySQL, cache it and then provide the response containing their messages.
A span may or may not have a parent span:
- A span without a parent is called a “root span” for example, span “/messages”
- A span with a parent is called a “child span” for example, spans “auth”, “cache.Get”, “mysql.Query”, “cache.Put”
Requirements
In the following documention, we assume that you already have connected your application to PM2 Enterprise (either on-premise or cloud). Also there are different requirements depending on the runtime you are using:
- NodeJS:
- You must at least use node
6.0.0. - If you use PM2, be sure that its version is above
3.4.0 - If you use the standalone agent, the
@pm2/ioversion should be above4.1.1
- You must at least use node
- Golang:
- You must at least Golang
1.8
- You must at least Golang
Of course in any cases, we advise to use the latest version since they improved the suppot for tracing a lot recently.
If you are interested, there are more documentation in the NodeJS APM readme there:
Golang
Please directly see the documentation of the Golang agent available in it’s readme there:
Common Questions/Issues
-
The UI miss some graphic to have an historical view of latency
We agree and we are open to any feedback for visualization or amelioration for the issue, please use the feedback buttom at the top-right of the application.
-
It fail to capture request with my application
Please launch your application with the debug log of the apm with the env var
DEBUG=axm:tracing, and send us the logs with a support ticket (available at the bottom left of the application or at tech@keymetrics.io)