
P(rocess) M(anager) 2
Plus
Once you go serious about production, you need to make sure that your application is running properly, without bugs, without performance issues and without downtimes.
That’s why we created PM2 Plus. It’s a set of features for both hardening your current PM2 Runtime Process manager and monitoring applications in production.
With PM2 Plus you get:
- A Real-time Monitoring Web Interface
- Issues & Exception Tracking
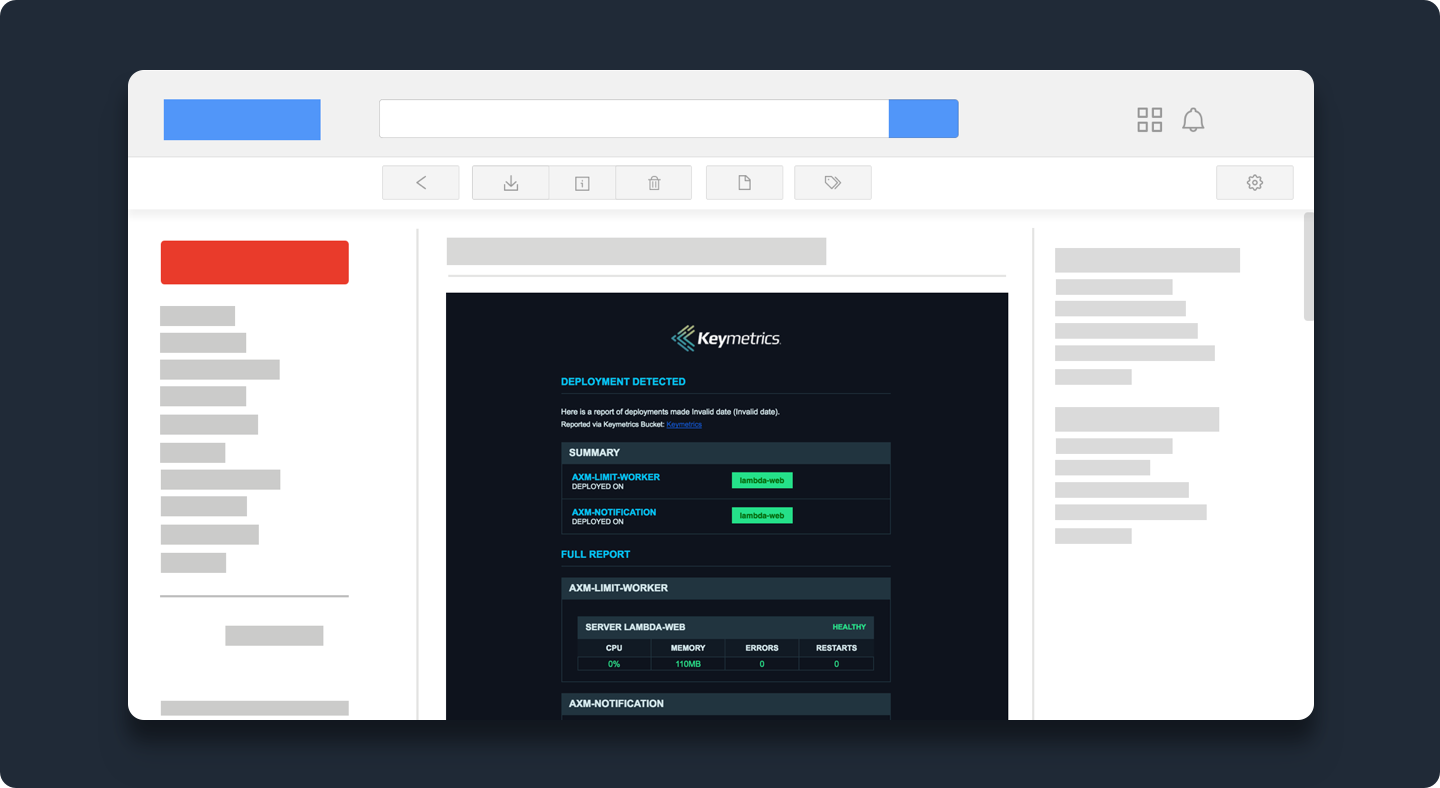
- Deployment reporting
- Realtime logs
- Email & Slack notifications
- Custom Metrics Monitoring
- Custom Actions Center
To start testing, you can either go to app.pm2.io or use the pm2 cli (pm2 above 3.2.7):
pm2 plus
Features available in PM2 Plus
Server overview
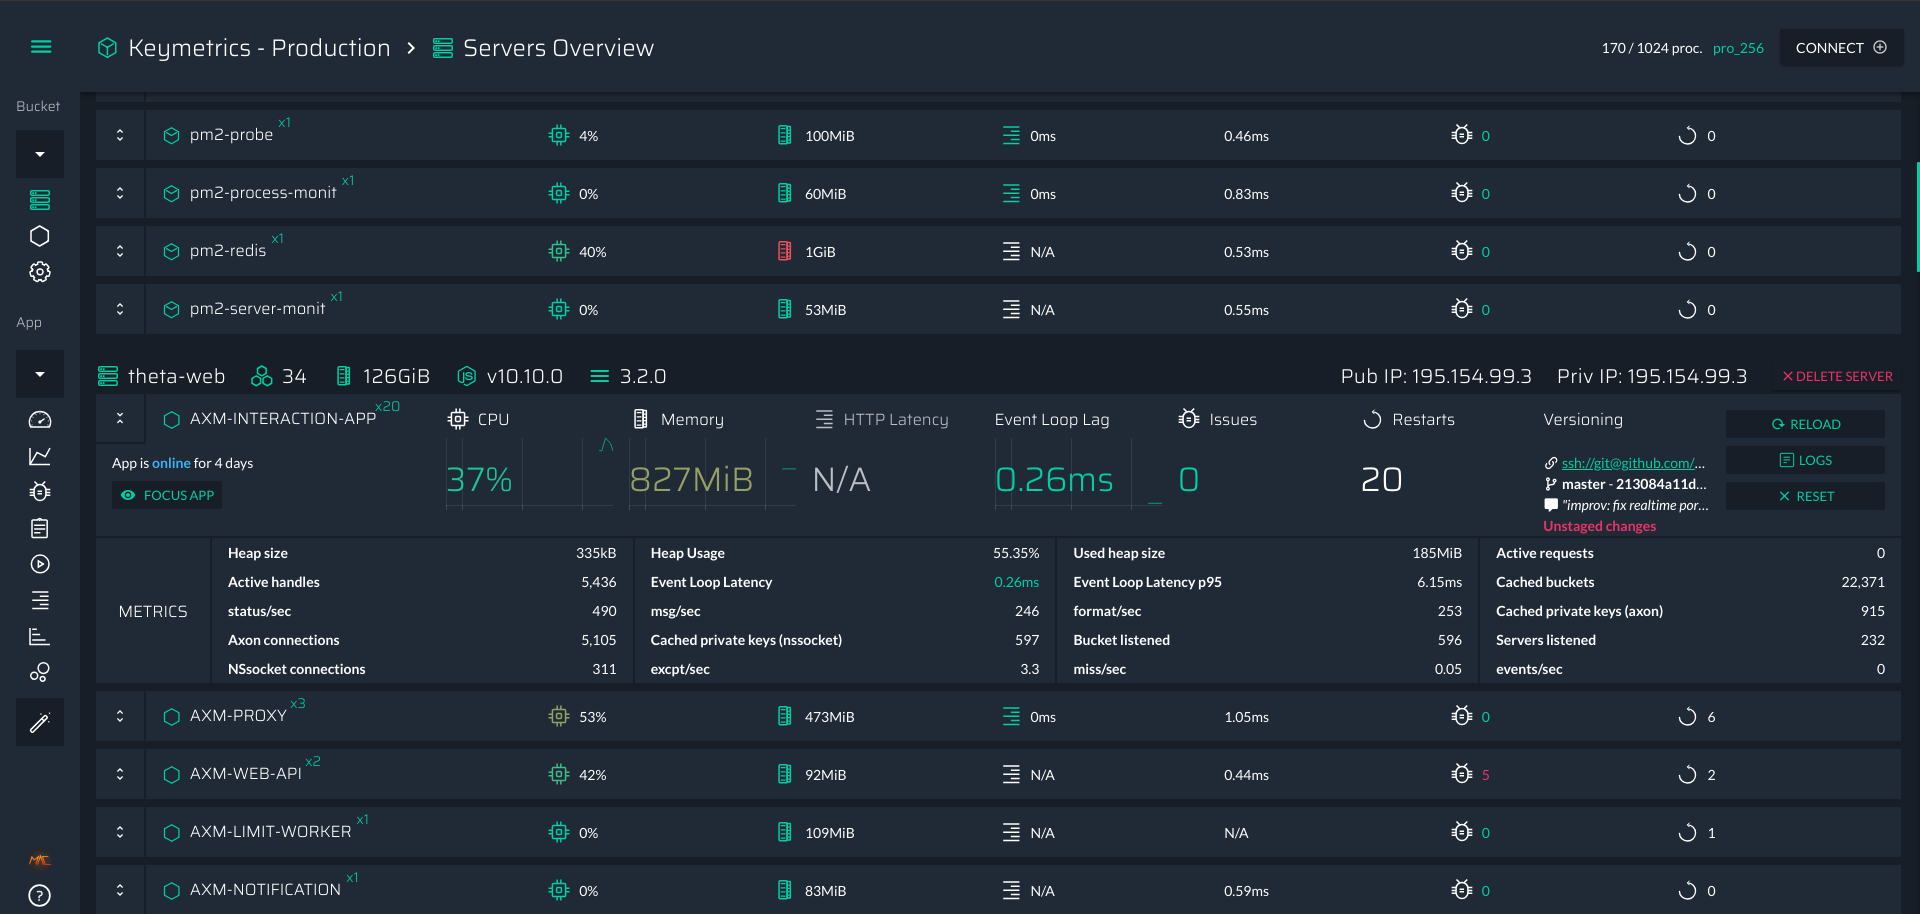
PM2 Plus allows you to have an extended view of all your apps and databases in one single place, at real-time or through history. Stop ssh in all your servers one by one, instead, save time by having a condensed infrastructure plus view.
Metrics Histogram
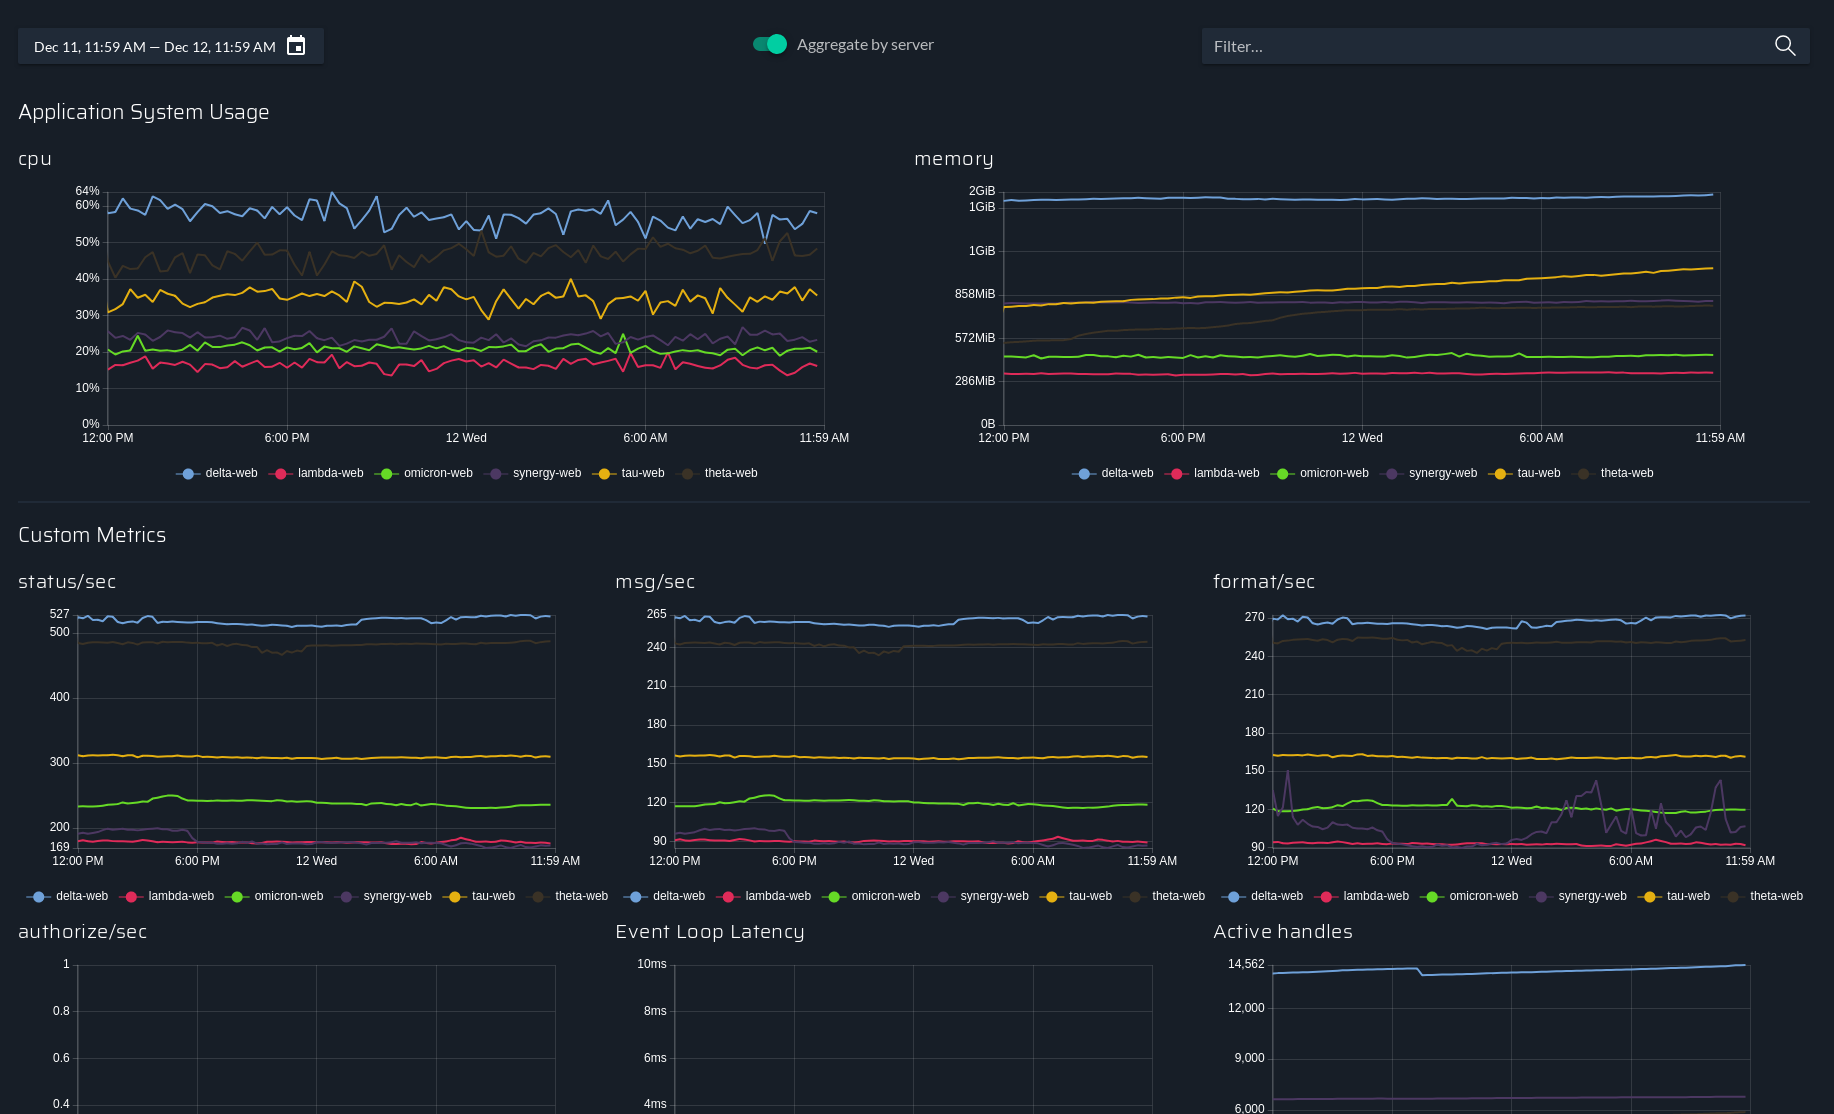
Expose the important variables from your Node.js applications source code and display them as performance metrics on the PM2 Plus dashboard. Monitor values that matter.
Notifications
Know when an error occurred in your application or when your production application is down.
Even though PM2 makes sure that your application have no downtime, be notified in these critical situation in order to react. Be notified and reactive in any critical situations.
Issues Dashboard
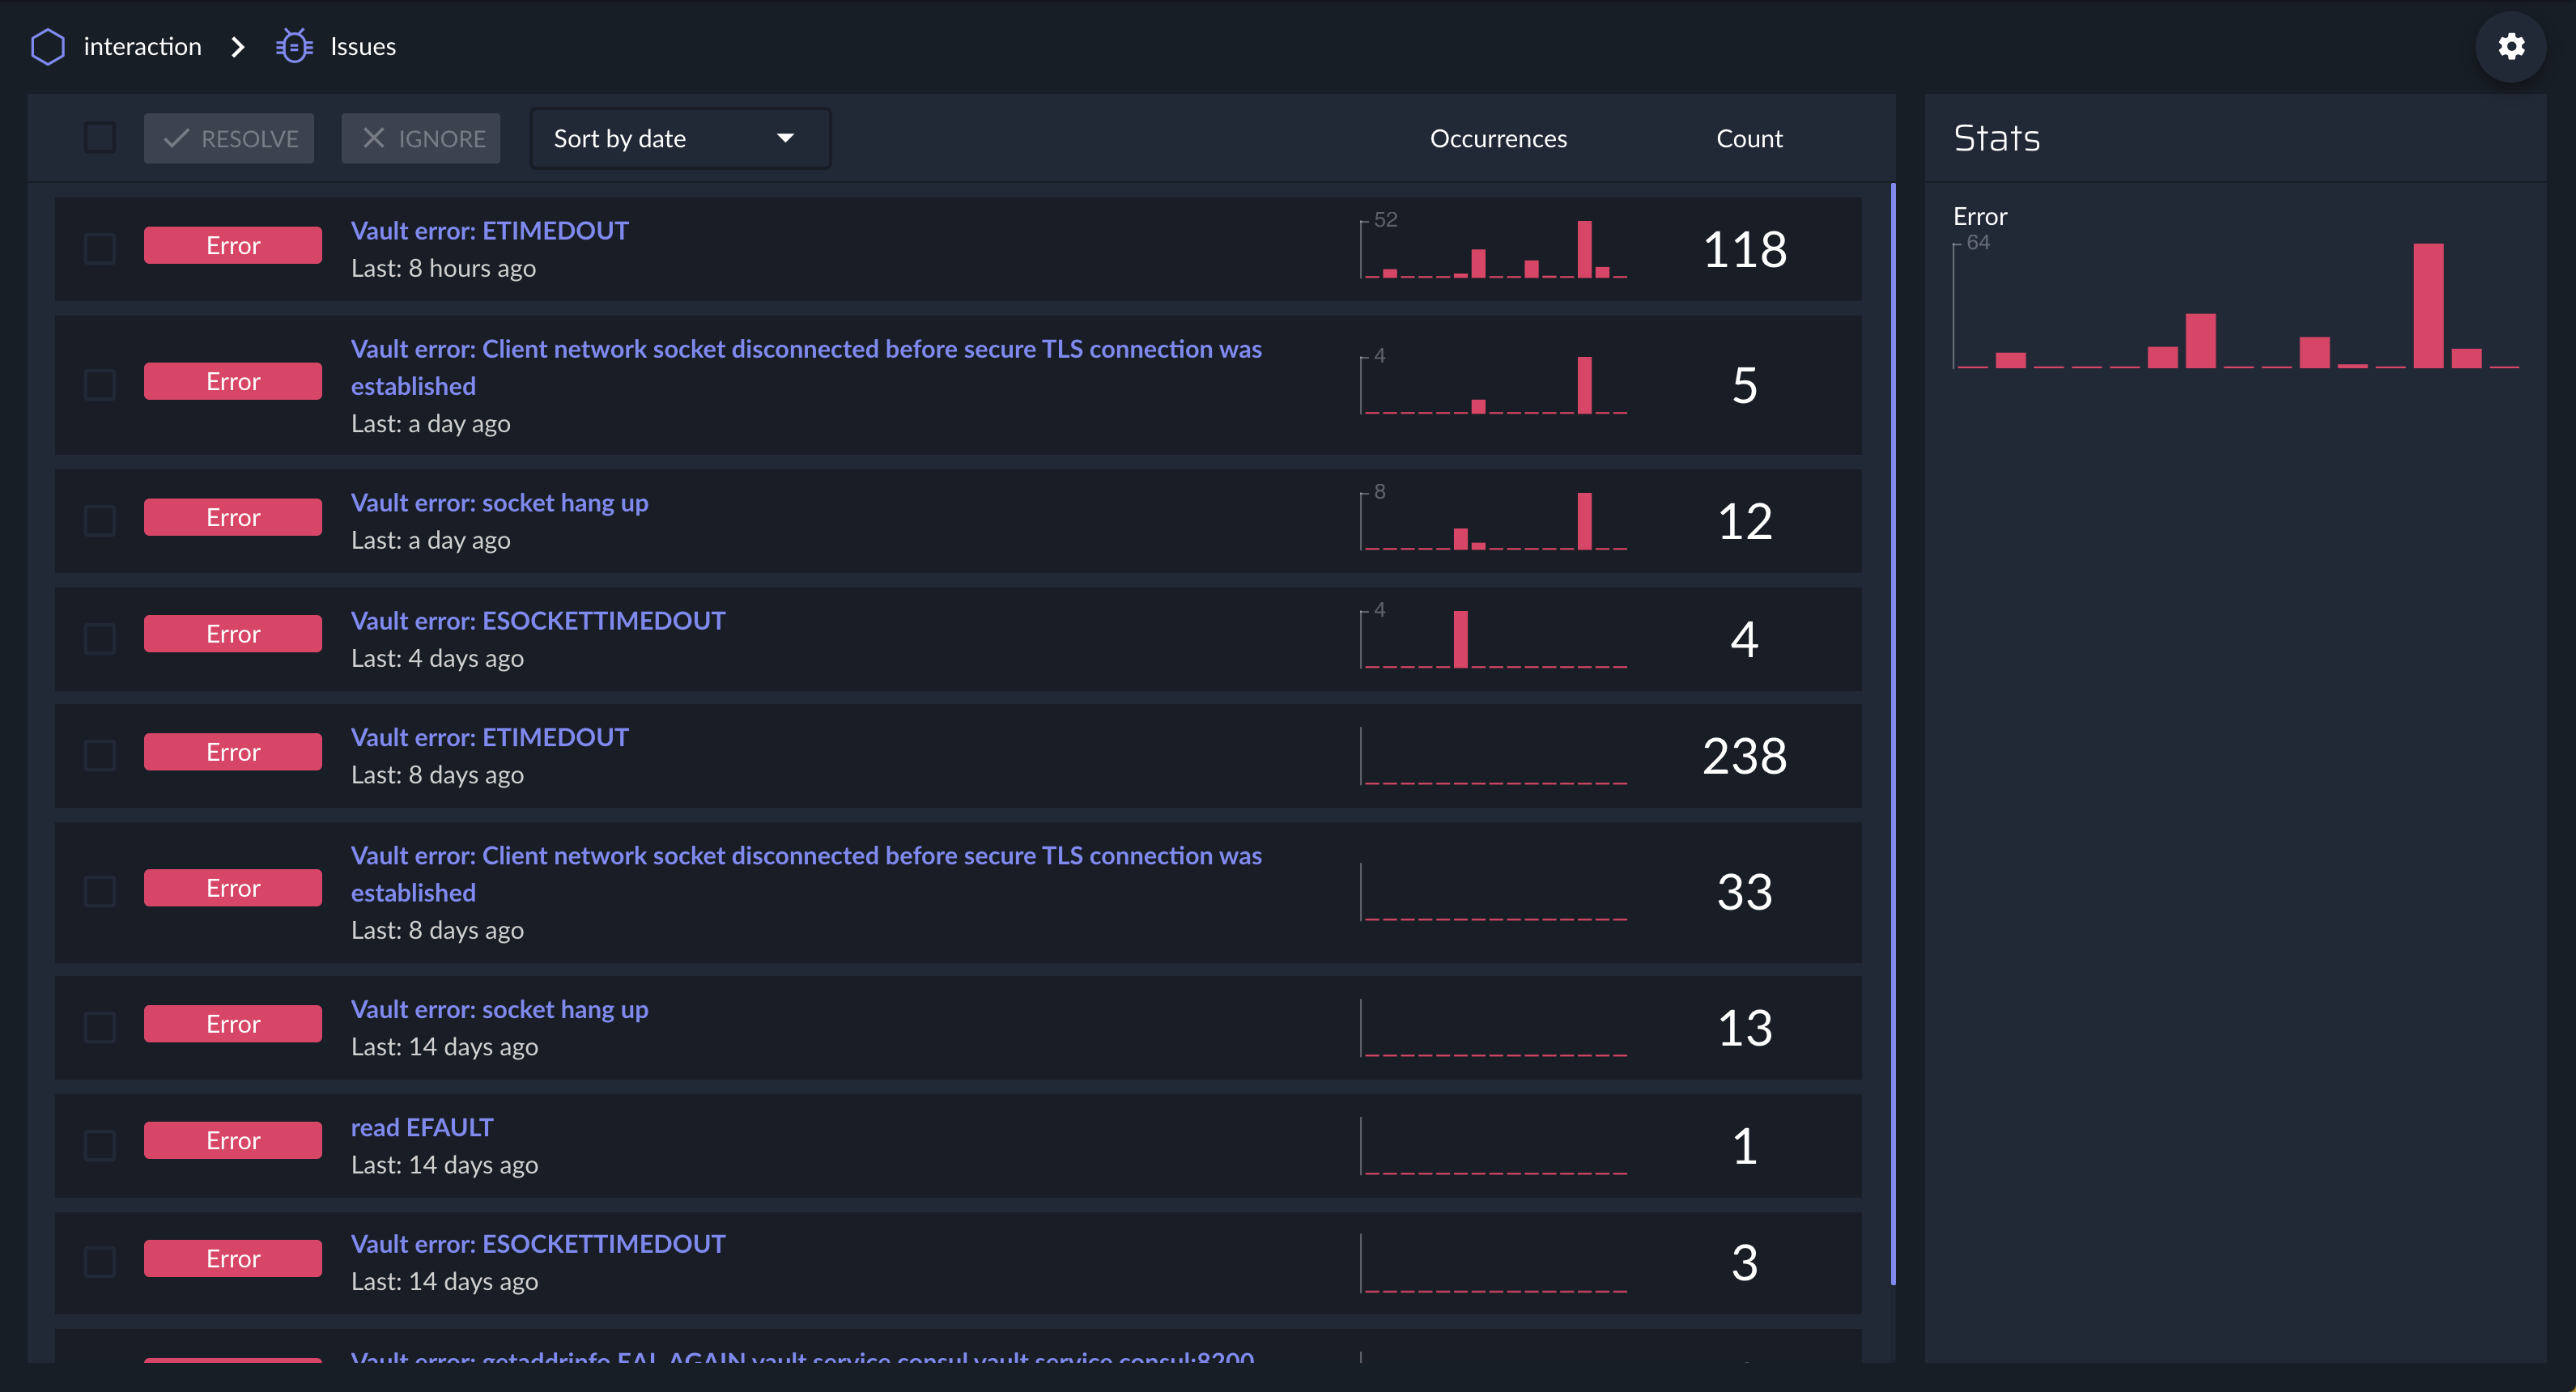
PM2 Plus reports the list of all errors in the “Issue Dashboard” occurred in your Node.js and gets you notified.
Stop spending time finding bugs or trying to replay them, we provide you an “Issue Dashboard” with everything in one place, to make debugging easier. Drill down in your code and get the answer.
Custom Actions
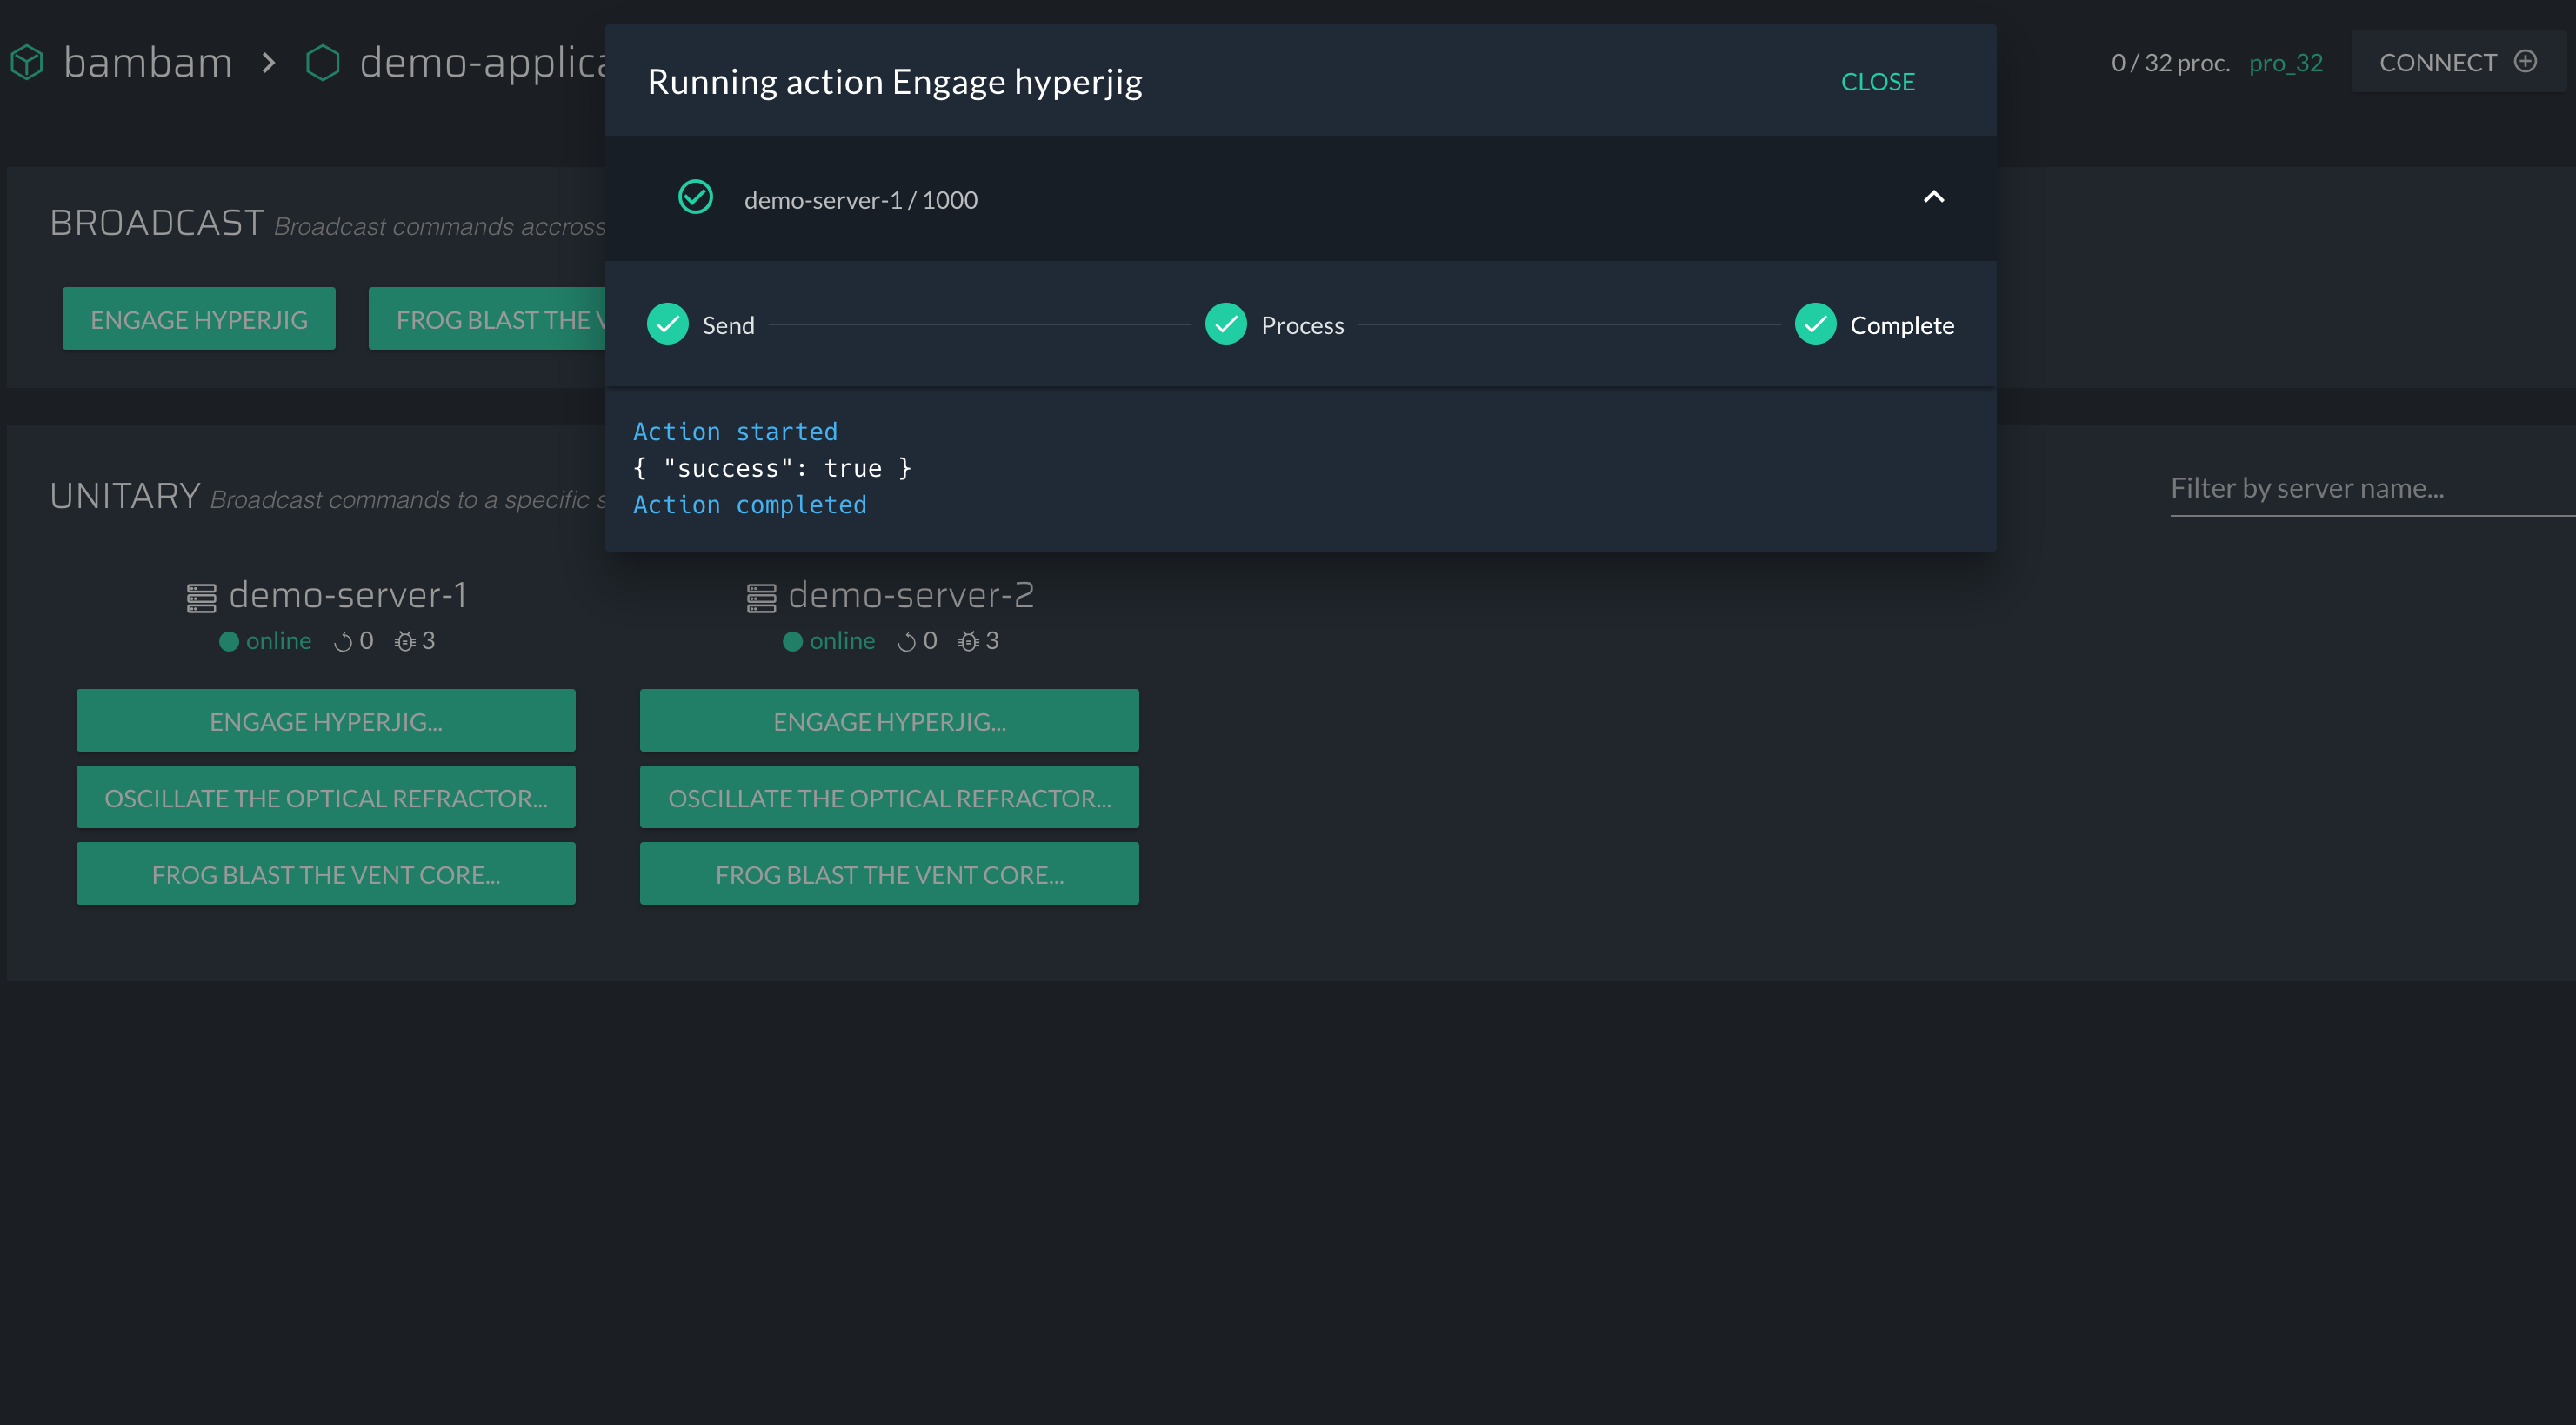
PM2 Plus makes possible to enhance custom functions in the source code of your application.
For example, you can assign values to your application variables or just switch it to maintenance mode. In other words you can expose triggerable functions in your code.
You will to use the the @pm2/io module comes along with PM2. It is the PM2 part responsible for gathering the metrics, reporting exceptions, exposing remote actions and every outside interaction with your application.
Realtime logs
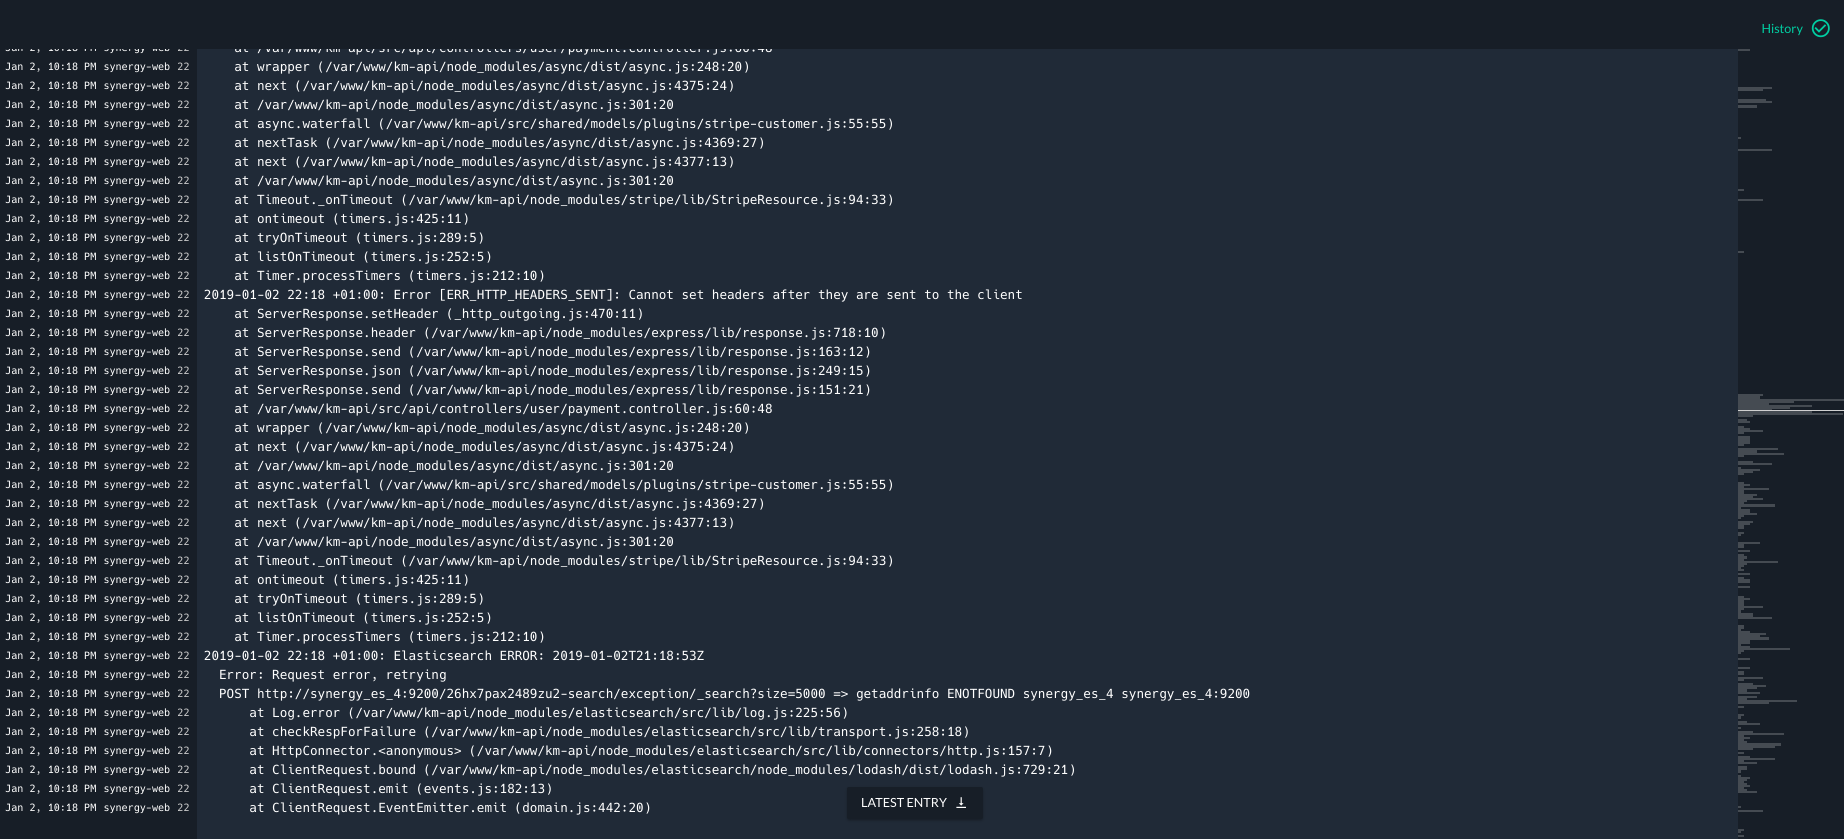
PM2 Plus allows you to see the logs of all of your applications managed by pm2 in one place in the cloud.
No need to ssh into your servers and use pm2 logs anymore, everything is on the web interface.
Third-party modules
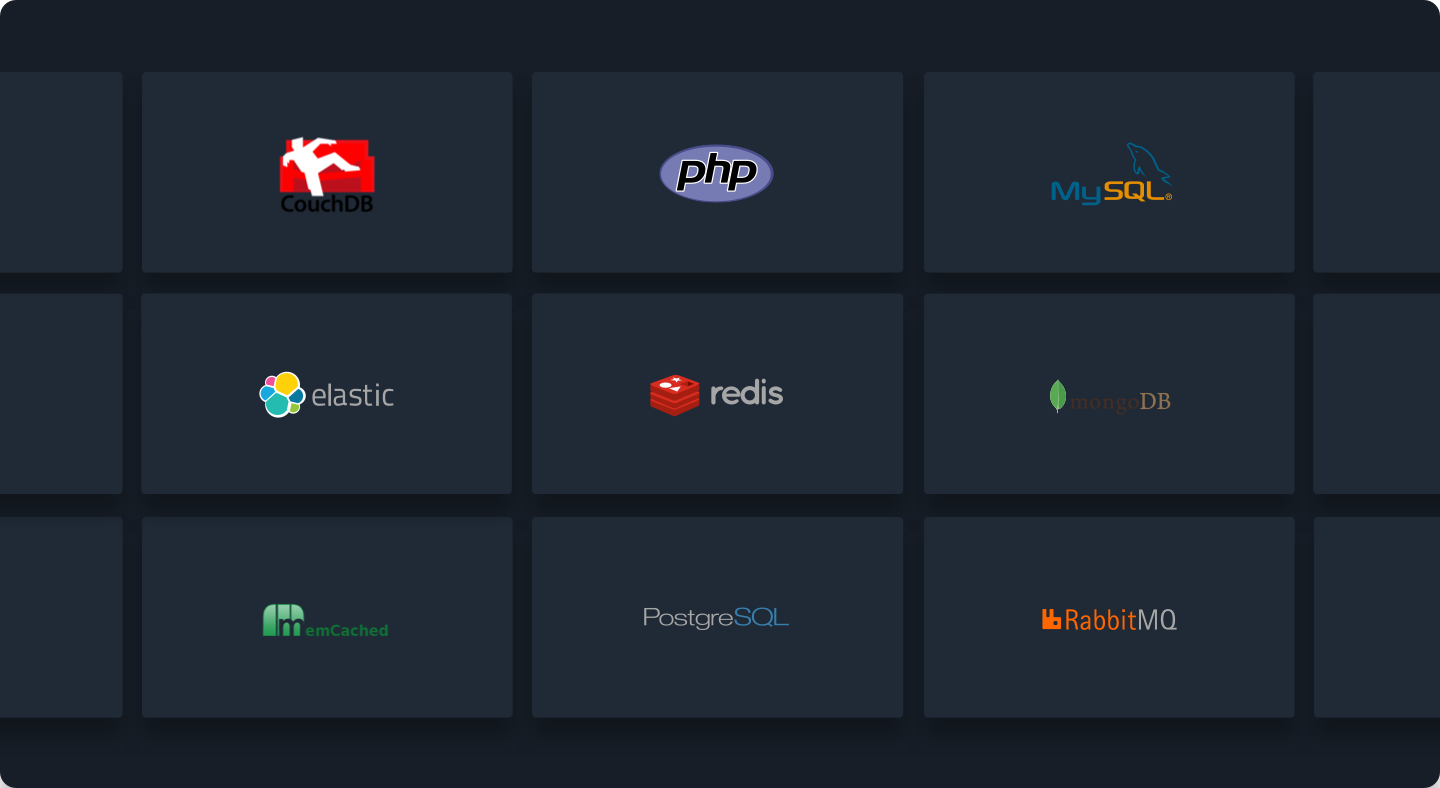
Extend the capabilities of the PM2 Plus dashboard by using external modules listed in our module page. Monitor your databases metrics to know what going on in your infrastructure